Deconstructing Pop Culture: How Much Money Has the Warner Music Group Made Since 1968?
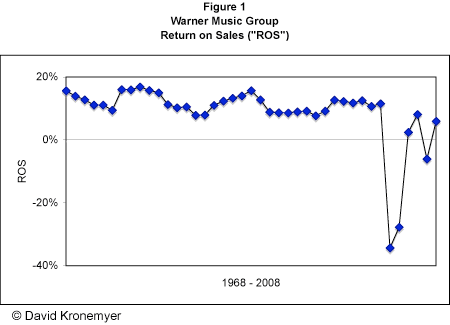
COLUMN: The answer is $5.1 billion pre-tax operating income on $83.6 billion of operating revenue, which is about how much people spend on French fries during one year in the U.S. I went through all of the Warner Communications, Time Warner and AOL Time Warner annual reports since 1968 and pulled the segment financial data for the Warner Music Group or its predecessor companies. This typically is buried in a footnote somewhere to the rear of the annual report and in most cases takes some sleuthing to extract. The results are depicted at Table 1 (all dollar amounts in thousands) and Figure 1. (Scroll down page to view both charts.)
 I picked 1968 because this was the first year that what evolved into the Warner Music Group came into existence. For a history of how this happened, see Connie Bruck’s “Master of the Game,” which is a history of Steve Ross and the early days of Warner Communications. She details all of the interesting corporate machinations in great detail. In October 1967 Ahmet Ertegun sold Atlantic Records to Warners for $17.5 million (source: “Music Man” by Dorothy Wade and Justine Picardie). And in 1970 Jac Holzman sold Elektra Records to Warners for $10 million (source: “Follow the Music” by Jac Holzman and Gavan Daws). So 1968 seemed like the best place to start.
Annual reports and such since around 2002 are publicly available on a site maintained by the Securities & Exchange Commission called “Edgar” (it’s an acronym for something, I’m not sure what). As an on-again off-again stockholder in these various business organizations, combinations and permutations I accumulated a stash of annual reports for prior years. I’m going to scan them and put them up on the web as a public service at www.deconstructingpopculture.com. There doesn’t appear to be any other ready source for them and there’s no indication they’re subject to copyright. Undoubtedly there exists a small sub-population of nerds like me who might enjoy looking at them or using them for “research.” Or laughing at them, like comic books or graphic novels. Generally speaking, with their over-the-top corporate boosterism, they don’t age that well.
For clarification, “operating revenue” and “pre-tax operating income” are financial results directly attributable to the applicable business segment. They exclude all kinds of financial machinations imposed by the corporate group, such as interest, taxes, depreciation and amortization. Warner Communications, for example, disastrously took on Atari and therefore incurred large corporate losses circa 1983, but this had nothing to do with the music group. It merged with Turner Broadcasting, Time Magazine and AOL, and the music group simply kept chugging along. OR and PTOI do however include all of the division’s folderol such as big salaries, T&E, payments to strippers, etc. (unless they are corporate strippers, in which case their cost would be journaled back to the corporate group) (don’t laugh, I’ve seen this happen). “Return on Sales” simply is the ratio between pre-tax operating income and operating revenue. It’s the best measure available from a practical standpoint of how a division or segment’s doing.

These results have several annoying features. First, there’s little consistency between general ledger categories for different companies, and even the same company capriciously changes the way it reports its financial results from time to time. Second, management does not hesitate to re-state prior year operating results when they add or dump divisions, or change their accounting practices. Third, there are all kinds of little tricks accountants use to manipulate revenue and earnings, such as: changing fiscal years; deferring sales by holding back or accelerating releases; taking and releasing reserves against returns and obsolescence; recognizing or deferring recognition of advances; and amortizing the value of assets rather than expensing them. The reason why accountants enjoy doing this is to reduce volatility and “beautify” annual results by making them appear to be more stable over time. Although everything tends to even out, it makes it a challenge to compare results year-to-year. For this reason, while it might be interesting to match up each year with the biggest-selling records released during that year, I doubt if there’s much of a correlation.
I’m not sure if this situation will ever change, given the lassitude of financial reporting practices of U.S. companies and the lack of regulatory interest in doing anything about it. Sometimes companies are tempted to give a “historical overview” of their last several years of results. These must be regarded with skepticism, because they particularly are susceptible to these problems. I looked at each annual report separately in an attempt to mitigate against them.
I haven’t adjusted any of the OR or PTOI numbers for inflation, because it’s ROS that really counts. And on that score I have to say that it does seem pretty low. Until recently, for example, newspaper companies routinely achieved ROS around 25-percent. Record company ROS has remained low, even with the advent of CDs and their supposedly-gynormous profit margins in the mid-1980s. Conversely the returns scare of the early 1980s and the independent promotion brouhaha of the late 1980s don’t seem to have impacted profits all that much. In the investment banking world, record companies typically have been regarded as good cash generators, but not all that great from an ROS perspective. There definitely is some truth to that point of view.

PTOI has been disastrous since Warner Music Group was acquired by Bronfman et al. Factors impacting it are: (a) the volatility of being a stand-alone, independently viable (to the extent it is) company; (b) industry-wide issues regarding peer-to-peer file sharing (which the record companies like to call “piracy”); and (c) the depredations of the Bronfman regime.
The number for the music group typically includes music publishing, which of course is a different kettle of fish than selling records. This actually was broken out as a separate operating revenue result during 1971 – 1982; and again from 2001 – 2008. During the first period it ranged from 4.2-percent to 6.4-percent of total music group operating revenue, and 13.4-percent – 17.8-percent during the second period. Before undertaking this exercise I thought it was a lot higher. It seems likely that for most of the time it averaged somewhere in the range of 10-percent – 15-percent. During the second period (2001 – 2008) music publishing PTOI also was stated separately, and it averaged 8.7-percent. This was considerably higher than PTOI for the rest of the music group during that period but still not all that great.
Any way you look at it, these probably are the best results that are publicly available. I think it’s a cryin’ shame how companies trash their former operating histories. I doubt that the current management of Warner Music Group knows anything about how their company has done past the last few quarters. Maybe if they had looked at historical operating results more carefully, they would have been able to discern how difficult it is to maintain competitive ROS, particularly given issues such as volatility, extent of capital committed, and attractiveness on margin of other potential investment candidates.
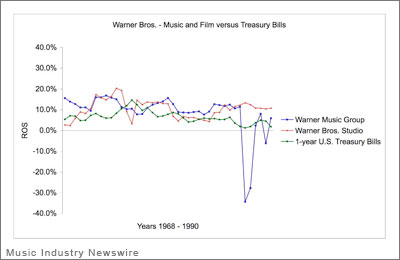
Next up: how did Warner Music compare with Warner Bros. Studios? Also, an analysis of CBS Records operating results, which will answer the perennial question: who did better, Mo Ostin or Walter Yetnikoff?


Apr 8, 2009 @ 4:30 AM PDT
From Wikipedia, EDGAR is the Electronic Data-Gathering, Analysis, and Retrieval system.